


The dashboard provides you with a comprehensive overview of your project’s progress. It brings together various indicators and charts to track observations and analyze construction site data.
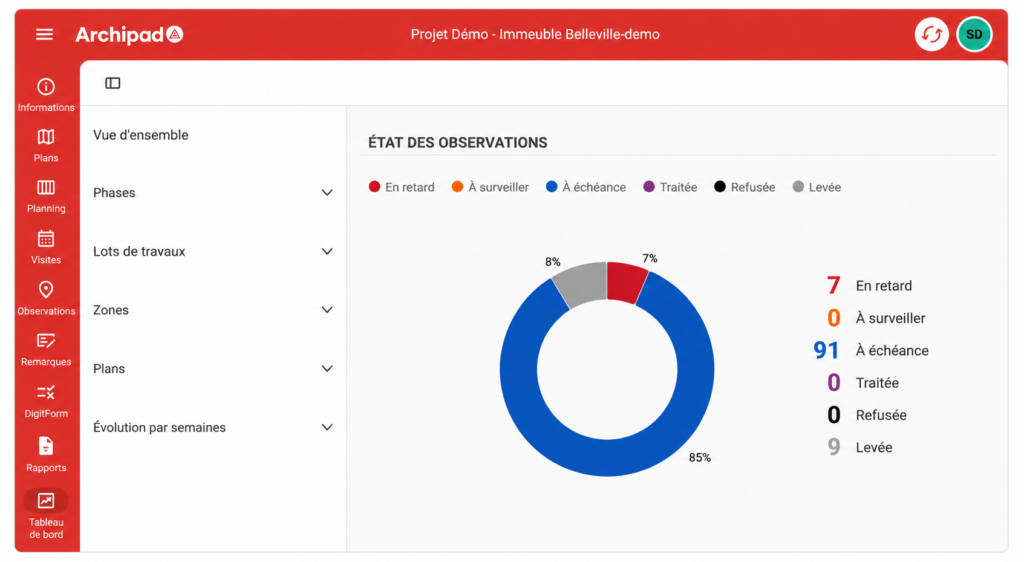
Access the Dashboard
- Open the desired project.
- Click on Dashboard in the side menu.
The dashboard automatically displays the various available indicators.
View the Indicators
The dashboard is organized into several sections that allow you to analyze project observations according to different criteria.
Observation Status
The pie chart shows the distribution of observations by status:
- Overdue
- Monitor
- Due
- Processed
- Rejected
- Resolved
The values displayed are automatically updated based on observations recorded in the project.
Phases
This section displays the distribution of observations by phase to identify the project stages most affected.
Trade Packages
This view presents observations by trade package to facilitate tracking of different trades.
Zones
View the distribution of observations by zone to quickly locate areas requiring special attention.
Drawings
Check the number of observations associated with each project drawing.
Weekly Progress
This chart allows you to track the evolution of the number of observations over weeks and analyze construction site progress.
Things to Know
The dashboard is automatically populated from project observations. Charts are updated as soon as data is synchronized.